Ellipsoid fitting#
Napari-stress implements several algorithms for ellipse fitting. They all have in common that they return a napari vectors layer which represents the three major axes of the fitted ellipsoid. Napari-stress provides some further functionality to project the input pointcloud onto the surface of the fitted ellipsoid.
Napari-stress implementation Least squares ellipsoid fitting
Vedo implementation Statistical ellipsoid fitting
Quantification Quantify fit quality
Mean curvature Measure mean curvature on ellipsoid
import napari_stress
from napari_stress import approximation, measurements, vectors
import napari

import matplotlib.pyplot as plt
viewer = napari.Viewer(ndisplay=3)
Napari-stress implementation #
This is a least-squares approach at ellipse fitting.
pointcloud = napari_stress.get_droplet_point_cloud()[0][0][:, 1:]

expander = approximation.EllipsoidExpander()
expander.fit(pointcloud)

ellipsoid_stress = expander.coefficients_
viewer.layers.clear()
viewer.add_points(pointcloud, size=0.5, face_color='orange')
viewer.add_vectors(ellipsoid_stress, edge_width=1, edge_color='magenta')
napari.utils.nbscreenshot(viewer)

To display, where the initial input points would fall on the surface of the fitted ellipse, use the EllipsoidExpander’s fit_expand() function:
fitted_points_stress = expander.fit_expand(pointcloud)
viewer.add_points(fitted_points_stress, size=0.5, face_color='cyan')
napari.utils.nbscreenshot(viewer)

To display the corresponding normal vectors, simply retrieve them from the properties of the EllipsoidExpander:
normals = expander.properties['normals']
viewer.add_vectors(normals, edge_color='green', length=2, vector_style='arrow', edge_width=0.5)
napari.utils.nbscreenshot(viewer)

Vedo implementation #
This function re-implements the respective function from the vedo library. It applies a PCA-algorithm to a pointcloud to retrieve the major and minor axises of an ellipsoid, that comprises a set fraction of points within its volumne. The inside_fraction parameter controls how many points of the pointcloud will be located within the volume of the determined ellipsoid.
ellipsoid_vedo = napari_stress.fit_ellipsoid_to_pointcloud_vectors(pointcloud, inside_fraction=0.675)
expander.coefficients_ = ellipsoid_vedo
fitted_points_vedo = expander.expand(pointcloud)
viewer.layers.clear()
viewer.add_points(pointcloud, size=0.5, face_color='orange')
viewer.add_vectors(ellipsoid_vedo, edge_width=1, edge_color='magenta')
viewer.add_points(fitted_points_vedo, size=0.5, face_color='cyan')
napari.utils.nbscreenshot(viewer)

Fit quality quantification #
Lastly, if you wanted to quantify the fit remainder (i.e., the distance between the input and the fitted points), you can do this directly using the provided EllipsoidExpander object’:
expander.properties
{'residuals': array([0.96557094, 1.02913339, 1.01736608, ..., 1.16384485, 0.86929885,
        1.00748116]),
 'maximum_mean_curvature': 0.07505048474496134,
 'minimum_mean_curvature': 0.052514205088737574,
 'normals': array([[[ 2.75304514e+01,  3.30434020e+01,  2.15441396e+01],
         [ 1.79512885e-01,  1.06088104e-01,  9.78018629e-01]],

        [[ 2.86567037e+01,  3.37242714e+01,  2.14134405e+01],
         [ 9.61564762e-02,  5.82442479e-02,  9.93660676e-01]],

        [[ 2.79063860e+01,  3.50012782e+01,  2.14640833e+01],
         [ 1.37374254e-01, -8.06209499e-03,  9.90486404e-01]],

        ...,

        [[ 3.10338097e+01,  3.38254091e+01,  5.09304402e+01],
         [-1.34973298e-01, -1.05700950e-01, -9.85195168e-01]],

        [[ 2.89796776e+01,  3.50643816e+01,  5.11848308e+01],
         [-1.53345084e-03, -1.56136240e-01, -9.87734338e-01]],

        [[ 3.03534090e+01,  3.54564932e+01,  5.09277742e+01],
         [-1.00833131e-01, -1.90476649e-01, -9.76499527e-01]]])}
You can calculate the length of these vectors using numpy:
distance_vectors = vectors.pairwise_point_distances(pointcloud, fitted_points_vedo)

viewer.layers.clear()
viewer.add_vectors(distance_vectors, edge_width=0.3, edge_color='euclidian_distance', features={'euclidian_distance': expander.properties['residuals']})

napari.utils.nbscreenshot(viewer)

Mean curvature on ellipsoid #
Lastly, the curvature on the surface of an ellipsoid can be calculated esily with measurements.curvature_on_ellipsoid. Note: The bject returned from this function is of type LayerDataTuple, the structure of which is explained in the docstring. Use help(measurements.curvature_on_ellipsoid) to show.
result = measurements.curvature_on_ellipsoid(ellipsoid_stress, fitted_points_stress)
You can print the global curvatures on the ellipsoid: \(H_e\) (average mean curvature \(H_{e, 0}\) and maximal/minimal mean curvatures \(H_{e, M}\) and \(H_{e, N}\))
for key in result[1]['metadata'].keys():
    print(key, ': ', result[1]['metadata'][key])
H0_ellipsoid :  0.06632935563610765
H_ellipsoid_major_medial_minor :  [0.08211623521128655, 0.06563346684877151, 0.05525323952731744]
frame :  [0]
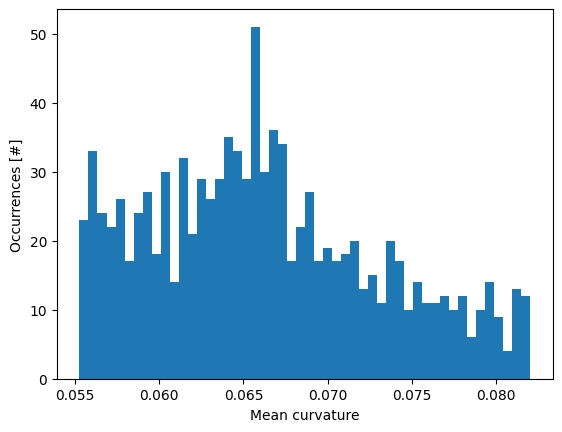
Plot a histogram of curvatures…
fig, ax = plt.subplots()
hist = ax.hist(result[1]['features']['mean_curvature'], 50)
ax.set_ylabel('Occurrences [#]')
ax.set_xlabel('Mean curvature')
Text(0.5, 0, 'Mean curvature')
…or visualize curvature in the napari viewer:
viewer.layers.clear()
viewer.add_points(result[0], **result[1])
napari.utils.nbscreenshot(viewer, canvas_only=True)
