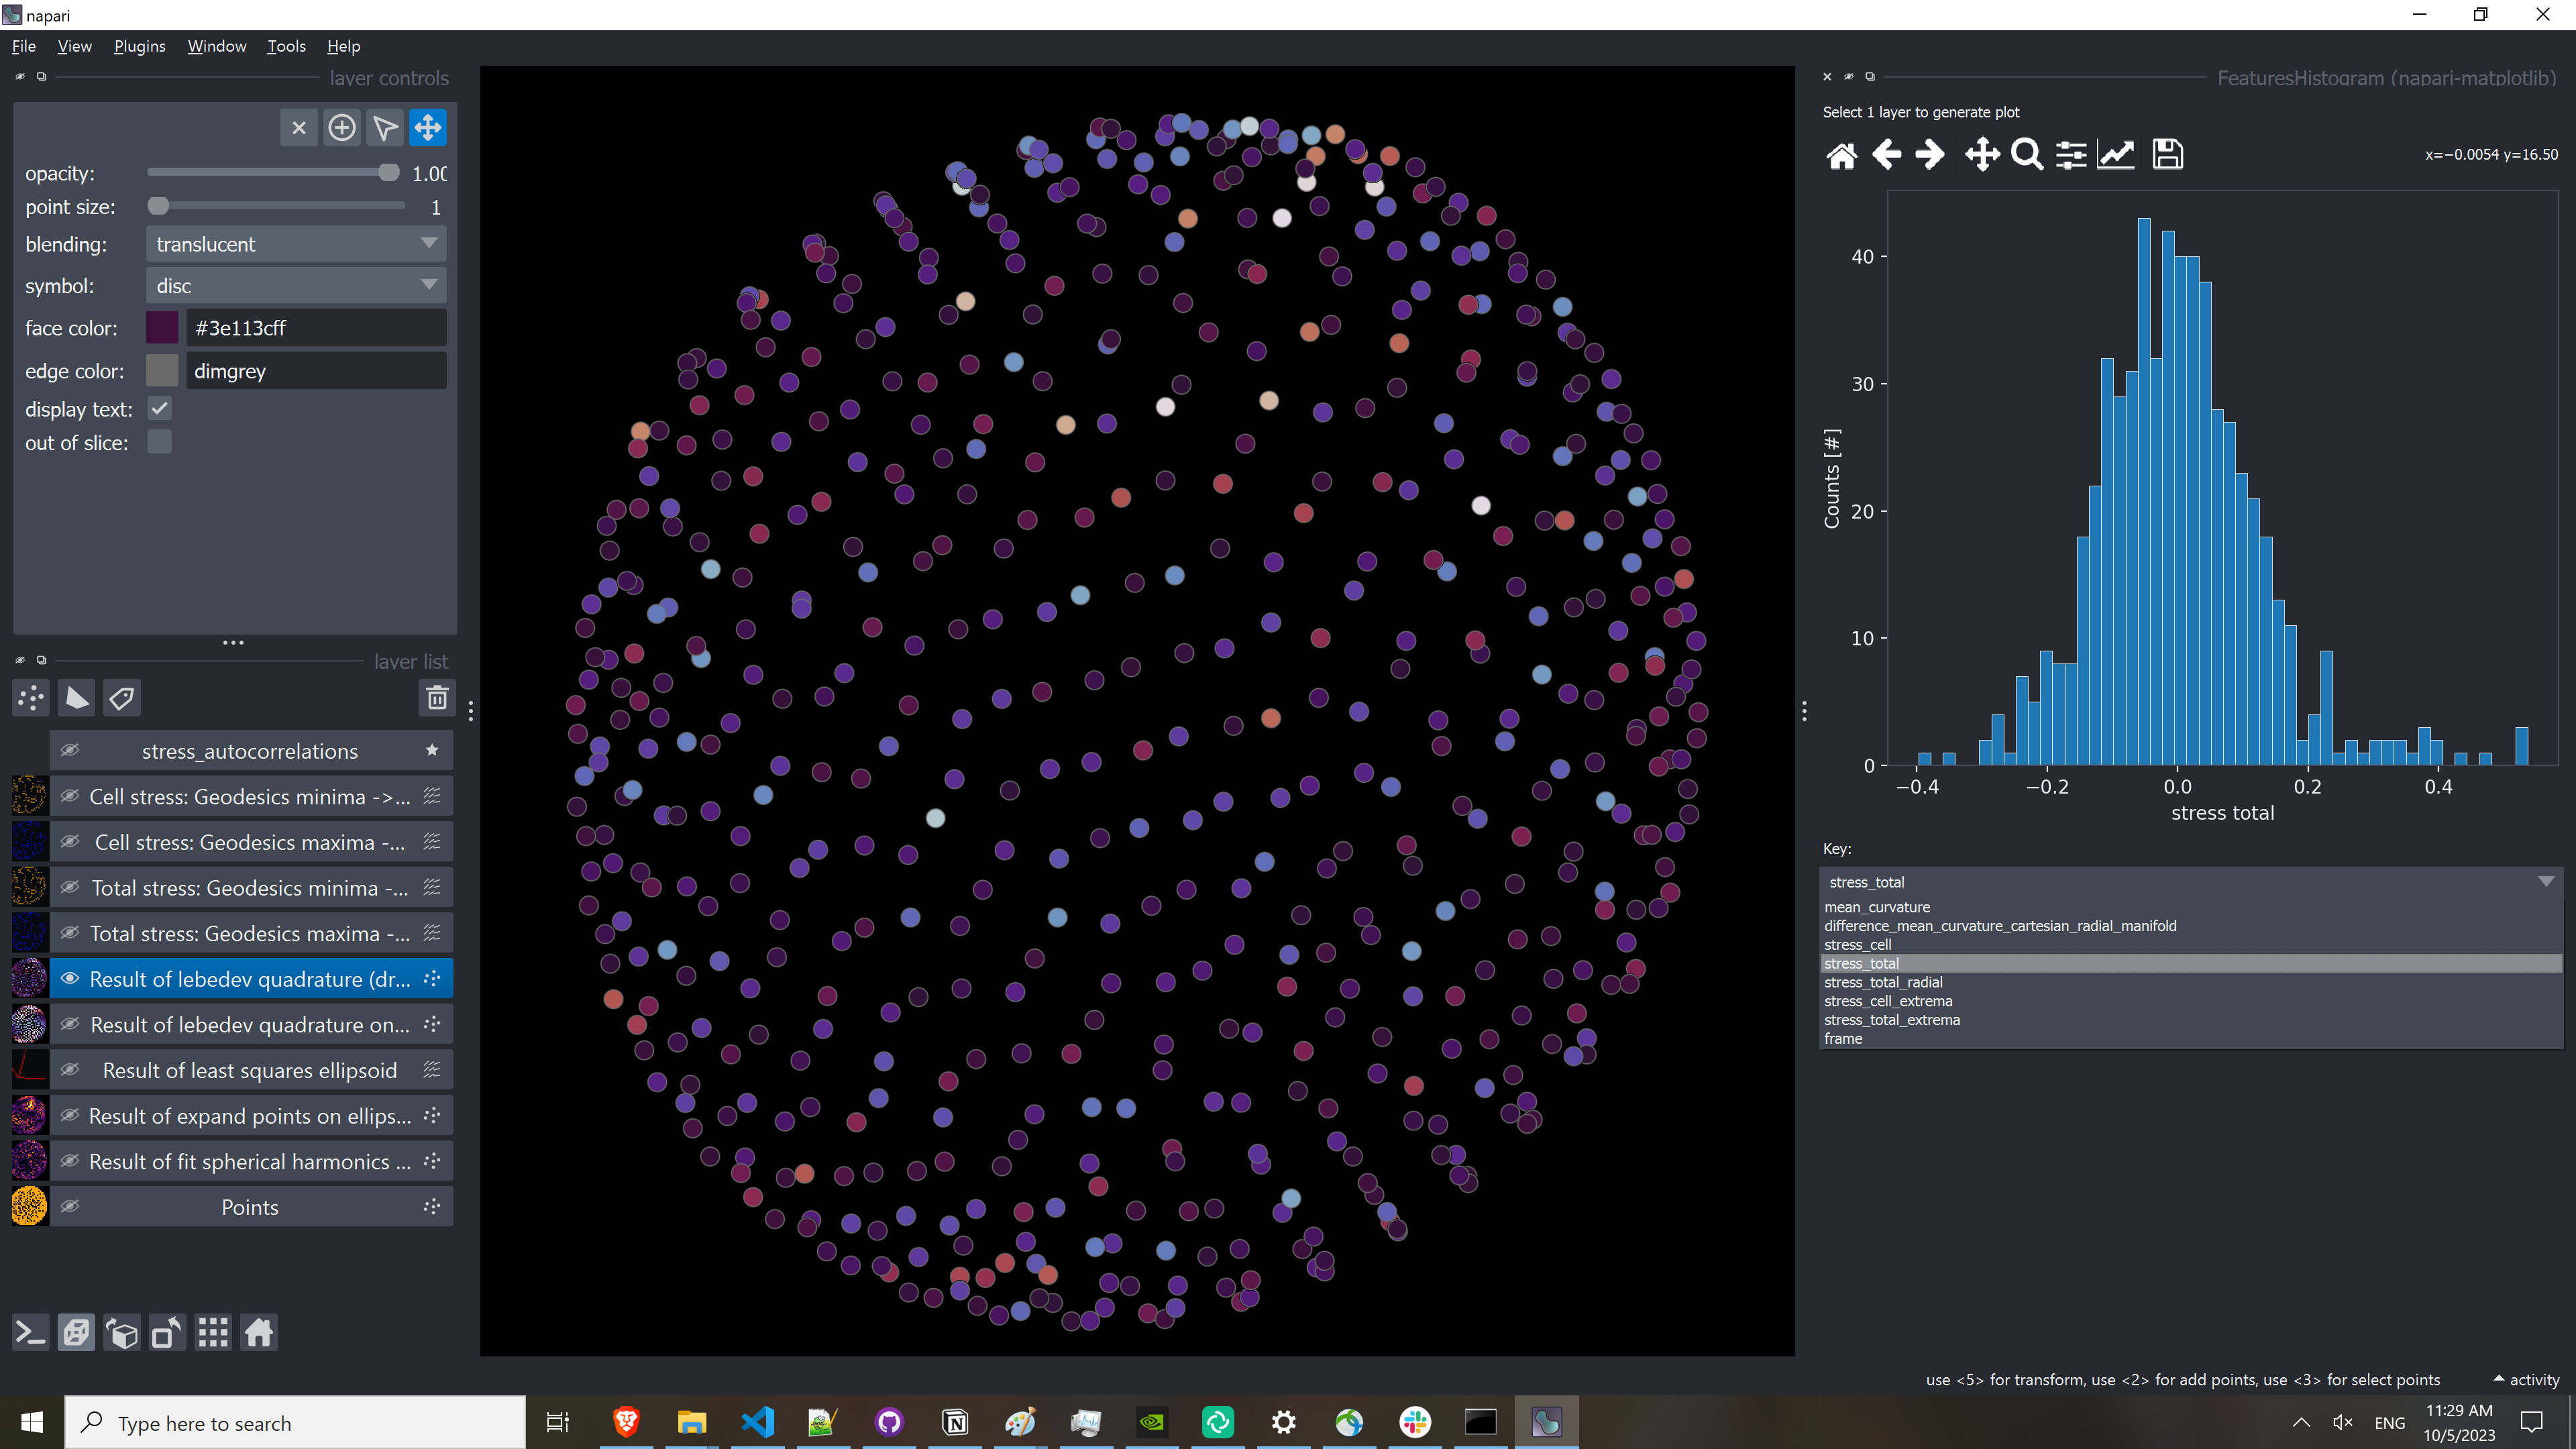
Visualize measurements#
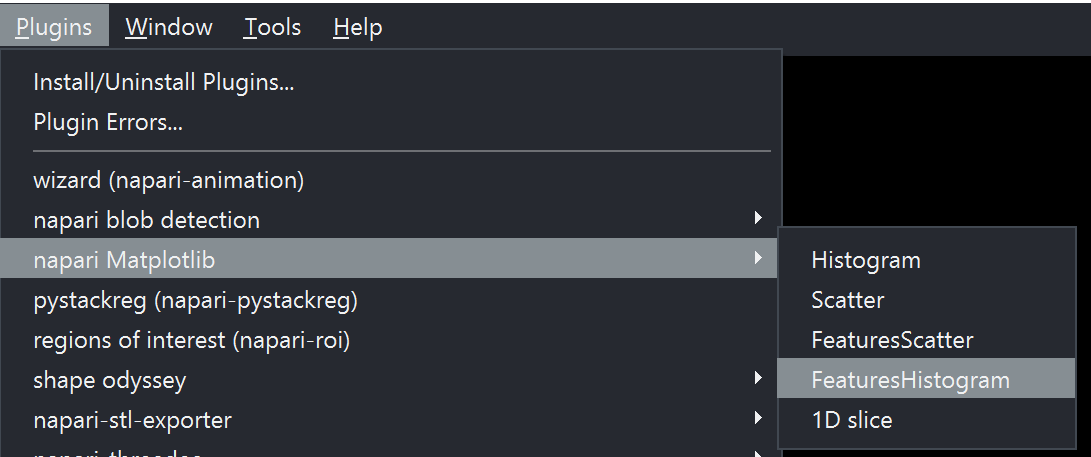
Napari-stress (and the measurement toolbox, in partciular) generate a number of measurements that can be visualized using the napari-matplotlib plugin. In order to use it, check out the documentation on the napari-matplotlib page. In the scope of napari-stress, what you will need, is the Features Histogram (Plugins > napari Matplotlib > FeaturesHistogram).
To display measurements, select a layer of interest and the dropdown in the newly created Histogram widget will show all possible features for you to highlight.